

In many companies, employee performance is not judged only on hard work or targets. Businesses also use different methods to compare overall performance across teams, and one of the most common methods is the Bell Curve in Performance Appraisal.
The bell curve is based on a simple idea — in every group, most people usually perform at an average level, while only a few fall into the highest or lowest category. Because of this, many organizations use the Bell Curve appraisal method during employee performance evaluation and performance review processes.
Over the years, the Bell Curve in HR has become a widely discussed topic in performance management because some companies believe it helps create a fair employee rating system, while others feel it can affect workplace morale. Understanding the Bell Curve meaning, how it works, and where it is used can help businesses build a better and more balanced performance appraisal system.
What is Bell Curve?
The Bell Curve is a way of showing how data is distributed in a group. In most cases, a large number of values stay around the average, while only a few fall on the higher or lower side. Since the graph looks similar to the shape of a bell, it is called the bell curve.
In companies, the Bell Curve in Performance Appraisal is often used to understand employee performance levels. Usually, most employees fall into the average performance category, a smaller group performs exceptionally well, and some employees may perform below expectations.
Because of this, many organizations use the Bell Curve in HR as part of their employee performance evaluation and performance management process. It helps managers compare performance in a more structured and organized way.
Bell Curve Formula
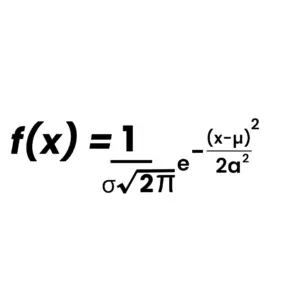
Here:
- f(x) is the value of the probability density function at a particular point x.
- μ (mu) is the mean (average) of the distribution, which is the center of the bell curve.
- σ (sigma) is the standard deviation, which controls the width of the curve. A smaller σ means the curve is narrower, and a larger σ means the curve is wider.
- e is Euler’s number, approximately 2.71828 (the base of the natural logarithm).
- π is the constant pi, approximately 3.14159.
- x is a point on the horizontal axis (where the value of the curve is being calculated).
Two important things help explain how the bell curve works:
- Mean (μ): This is the average value of the data and stays at the center of the curve. In employee performance evaluation, it usually represents the average performance level of a group of employees.
- Standard Deviation (σ): This shows how far the values are spread from the average. When the variation is high, the bell curve looks wider because employee performance differs more. When the variation is low, the curve becomes narrower, which means most employees perform around the same level.
In the Bell Curve in HR, these measurements are often used to understand how employee performance is distributed within a company.
Key Characteristics of Bell Curve in Performance Appraisal
The Bell Curve has a few common characteristics that make it useful in statistics as well as in the Bell Curve in Performance Appraisal process.
- Symmetrical Shape: The bell curve is balanced on both sides, which means the data spreads evenly around the average value.
- Highest Point at the Center: The peak of the curve stays at the mean or average point. This shows that most employees or data values usually fall in the middle range.
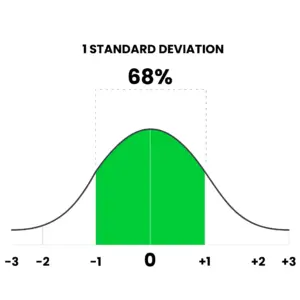
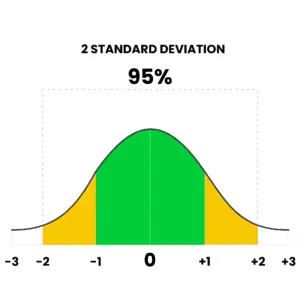
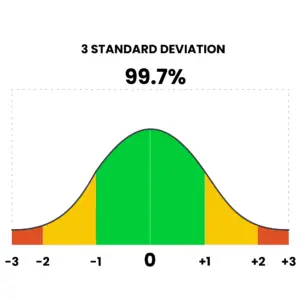
- Standard Distribution Pattern: In a normal bell curve distribution, around 68% of values stay within one standard deviation from the mean, 95% fall within two standard deviations, and nearly 99.7% remain within three standard deviations.
In the Bell Curve in HRMS, these characteristics help organizations group employee performance levels in a more structured way during employee performance evaluation and performance review processes.
Applications of Bell Curve
The Bell Curve is used in different fields to understand how performance or data is spread within a group. It helps people compare average results with higher and lower results in a simple way.
- Education: Schools and colleges use the bell curve while checking exam results and student performance. It helps teachers get an overall idea of how a class has performed.
- Healthcare: In healthcare, the bell curve is used while studying patient data and health reports collected from large groups of people.
- Business and HR: Many companies use the Bell Curve in Performance Appraisal during employee reviews. It helps managers understand employee performance levels across teams.
- Finance: In finance, the bell curve helps experts study market risks, stock price changes, and investment trends.
The Bell Curve in Performance Appraisal
In many organizations, the Bell Curve in Performance Appraisal is used to compare employee performance across teams and departments. The idea behind this method is simple — not every employee performs at the same level, so companies group employees into different performance categories.
Usually, employees are divided into top performers, average performers, and employees who may need improvement. This type of Bell Curve appraisal helps managers during employee performance evaluation and makes the performance review process more organized.
Over the years, the Bell Curve in HR has become a common part of performance management systems because companies use it to identify high performers, plan rewards, and understand overall workforce performance better.
The Basics of the Bell Curve in Performance Appraisal
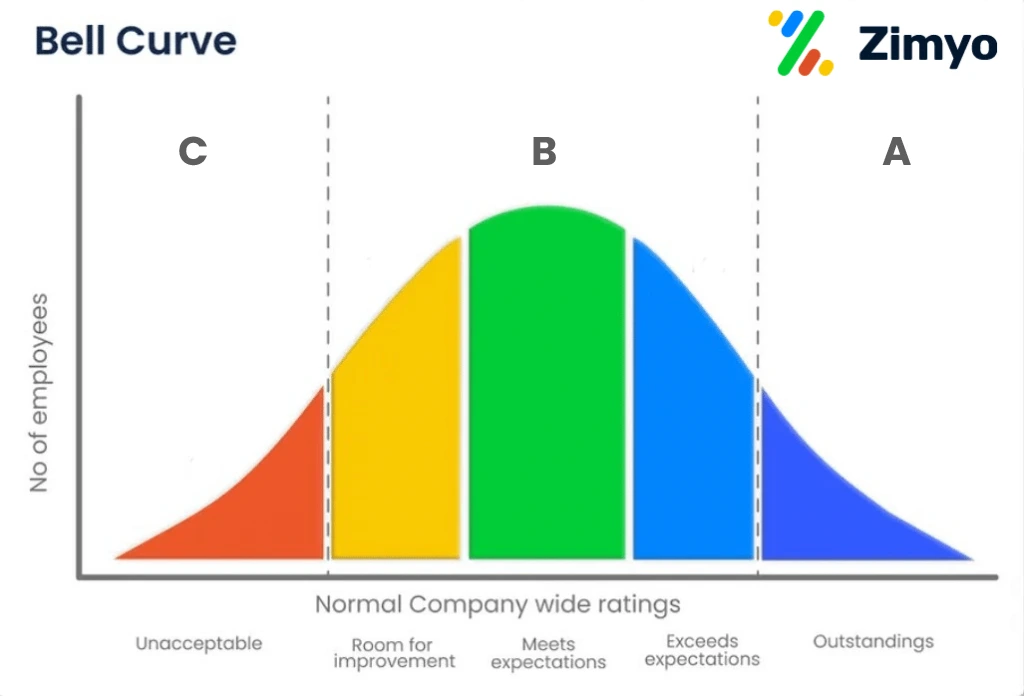
In a typical bell curve HR appraisal system, employee performance is ranked across a range of categories, typically divided into three main groups:
- Top Performers (A): These are the employees who perform at the highest level. They fall into the top 20% of the distribution and are often rewarded with promotions, bonuses, or other incentives.
- Average Performers (B): Most employees (usually around 70%) fall into this category. These employees meet expectations and perform well but may not exhibit exceptional achievements.
- Low Performers (C): Employees in the bottom 10-20% are considered low performers. They may require development plans, coaching, or even disciplinary actions.
Advantages and challenges of the Bell Curve in Performance Appraisal
No performance appraisal method is perfect. The Bell Curve has its own strengths and weaknesses. Let’s explore both.
Advantages
- Standardization: The bell curve in appraisals helps standardize evaluations across different departments or teams, making it easier to compare performance fairly.
- Easy Identification of Top Performers: The Bell Curve makes it easy for managers to identify high performers, helping with reward and retention strategies. For instance, employees in the top 20% can be fast-tracked for promotions.
- Objectivity: It reduces subjectivity in performance ratings and ensures that performance is measured against clear metrics.
- Balances Manager Bias: If a manager is too strict or too lenient, the Bell Curve forces a balanced evaluation. This keeps performance reviews fairer across the board.
- Resource Allocation: By categorizing employees into different performance tiers, HR can better allocate resources. For example, on the job training programs can be tailored for low performers, while development plans can be created for future leaders.
Criticisms and Challenges
While the bell curve distribution is widely used, it does have its fair share of criticisms and challenges:
- Forced Ranking: One of the biggest drawbacks of using this curve in performance appraisal is that it forces managers to rank employees even if the performance distribution doesn’t fit the curve. This can result in unfair ratings and may demotivate employees.
- Discrepancy in Team Performance: In teams that perform exceptionally well as a whole, applying the bell curve can be problematic, as even great employees may fall into the “average” or “low performer” category.
- Lack of Flexibility: The rigid structure of the bell curve system may not reflect the true performance of employees, especially in roles where performance isn’t easily quantifiable.
- Rigid System: Sometimes, the system’s rigidity means high performers don’t get the recognition they deserve, simply because there are too many high performers for the curve.
- Loss of Morale: Employees placed in the lower categories may feel demotivated, even if they are good performers. This can increase turnover costs.
- Not Ideal for Small Companies: If your company has fewer than 300 employees, the Bell Curve might not be suitable, as small data sets make it harder to distribute performance accurately.
Examples
Some large organizations like Infosys, Wipro, and ICICI Bank still use the Bell Curve in Performance Appraisal to assess thousands of employees. These companies rely on the Bell Curve appraisal method to identify top performers and manage reward systems in a structured way.
However, other companies such as Google and Microsoft have moved away from the traditional Bell Curve in HR approach. Instead, they prefer more flexible performance management systems that focus on continuous feedback and individual growth.
The main reason behind this shift is simple—many modern workplaces feel that employees should not always be forced into fixed categories. Instead, they should be evaluated based on their individual performance and contribution rather than fitting them into a strict Bell Curve distribution.
Does the Bell Curve Always Work?
Now, let’s ask the hard question: Does this method always work? Not always. While it offers a structured system, it can also be rigid. Here’s why.
Assumptions and Restrictions
- Rigid Pattern: The curve assumes that only a few employees will be high performers, while most will be average. But what happens if your team has higher performers than the curve allows? Managers may have to rank someone lower than they deserve, just to fit the curve.
- Restricted Ranking: Only 10% can be labeled as low performers, even if there are fewer than that. This can create unfair pressure on managers and employees.
Alternatives and Evolving Trends
To address some of the criticisms, companies are increasingly moving towards more flexible performance evaluation methods. Some of these alternatives include:
- Continuous Feedback Systems: Providing employees with ongoing feedback rather than annual performance appraisals.
- 360-Degree Feedback: Gathering input from peers, subordinates, and managers to get a more holistic view of employee performance.
- Employee Development Focus: Shifting the focus from ranking employees to identifying growth opportunities and providing training and support.
Conclusion
The Bell Curve in Performance Appraisal is still used in a lot of companies, especially when they want a quick way to understand how employees are performing across a team. It gives a broad picture—who’s doing well, who’s steady, and who might need some support.
That said, it’s not something every organisation relies on anymore. Some teams still follow the Bell Curve appraisal approach because it gives structure to reviews, while others have moved towards ongoing feedback instead of fixed rankings. There’s no one “perfect” method—it really depends on how a company wants to manage performance.
What matters more is whether the system actually helps employees improve instead of just categorising them. A fair review process should feel practical, transparent, and useful for both employees and managers.
Today, many HR teams also use tools like Zimyo to keep appraisals, performance tracking, and employee data organised in one place, so the process doesn’t become messy or manual.
At the end of the day, whether a company uses the Bell Curve in HR or another system, the real focus should stay the same—helping people perform better and creating a healthier work environment overall.
Add Your Heading Text Here
(Frequently Asked Questions) FAQs
The Bell Curve in Performance Appraisal is a method used by companies to evaluate employee performance by grouping them into categories like top performers, average performers, and low performers based on a normal distribution pattern.
The Bell Curve appraisal helps companies maintain performance standards, identify top talent, and create a balanced distribution of employee ratings. It can also support better decision-making in compensation and promotions.
One major drawback is that the Bell Curve in performance management can sometimes force employees into fixed categories even if performance differences are small. This may lead to dissatisfaction or unfair evaluation in some cases.
Yes, some companies still use the Bell Curve method in HRM, especially large organizations. However, many modern companies are shifting toward continuous feedback systems instead of strict ranking models, depending on their performance management approach.